

Electricity is the most common cause of accidental fires in the home, and homes are about to ask far more of their wiring: car chargers, heat pumps, solar panels and batteries all land on installations that were often designed decades ago. This page collects the published figures on electrical fires and shocks, the state of wiring in owned and rented homes, electric car charging, how fast homes are going electric, what electricity costs and who is qualified to do the work. Every figure links to the body that published it and carries the month of publication. Where a source gives a figure for Leeds, West Yorkshire or Yorkshire and the Humber, it sits beside the national one.
Martin Day Electricians is a NICEIC Approved Contractor working in homes across Leeds. We check each figure against its source every month and change the count in the heading when figures are added or retired.
Key Takeaways
- Fire services recorded 14,660 accidental dwelling fires in England in 2025/26 where the source of ignition was powered by electricity, 61.6% of the 23,795 total; the count includes electric cookers and is our calculation (MHCLG, Jul 2026).
- No smoke alarm was present in 24% (44) of the deaths in dwelling fires in England in 2025/26 (MHCLG, Aug 2026).
- 45 of the 56 UK counterfeit and lookalike Apple chargers tested (80%) failed the UK plug pin tests (Electrical Safety First, Nov 2024).
- Fire was the harm in 424 product safety notifications and electric shock in 226 in 2025/26, together 46% of those with a harm type (OPSS, Aug 2026).
- The share of English homes with all five electrical safety features rose from 67.3% in 2023 to 71.8% in 2024 (MHCLG, Jul 2026).
- More than half a million (503,805) battery electric cars were registered in the UK in the first ten months of 2026, up 30.4% on a year earlier (SMMT, Nov 2026).
- The Department for Transport now expects 2030 demand for public chargepoints to fall between 250,000 and 550,000, narrowed from an earlier 280,000 to 720,000 (National Audit Office, Dec 2024).
- Battery storage installations certified by MCS in the first six months of 2026 (36,000) almost matched the whole of 2025 (40,000), and 92% of them went onto homes that already had solar (MCS, Aug 2026).
- Of the 1.1 million smart and advanced meters installed by large suppliers in Great Britain in April to June 2026, 570,000 replaced an existing smart meter rather than a non-smart one (DESNZ, Aug 2026).
- Ofgem cut the electricity use of its typical household to 2,500 kWh a year in 2026, about 7% below the value it used before (Ofgem, Aug 2026).
- Median gross annual pay for UK electricians and electrical fitters was £39,917.60 in April 2026 (provisional), against £34,229.10 for all employees (ONS, Oct 2026).
How many house fires are caused by electricity?
Electricity starts roughly one in four accidental house fires in England, and that share has barely moved while cooking fires have fallen. Deaths are the exception: the yearly counts are too small to show a trend.
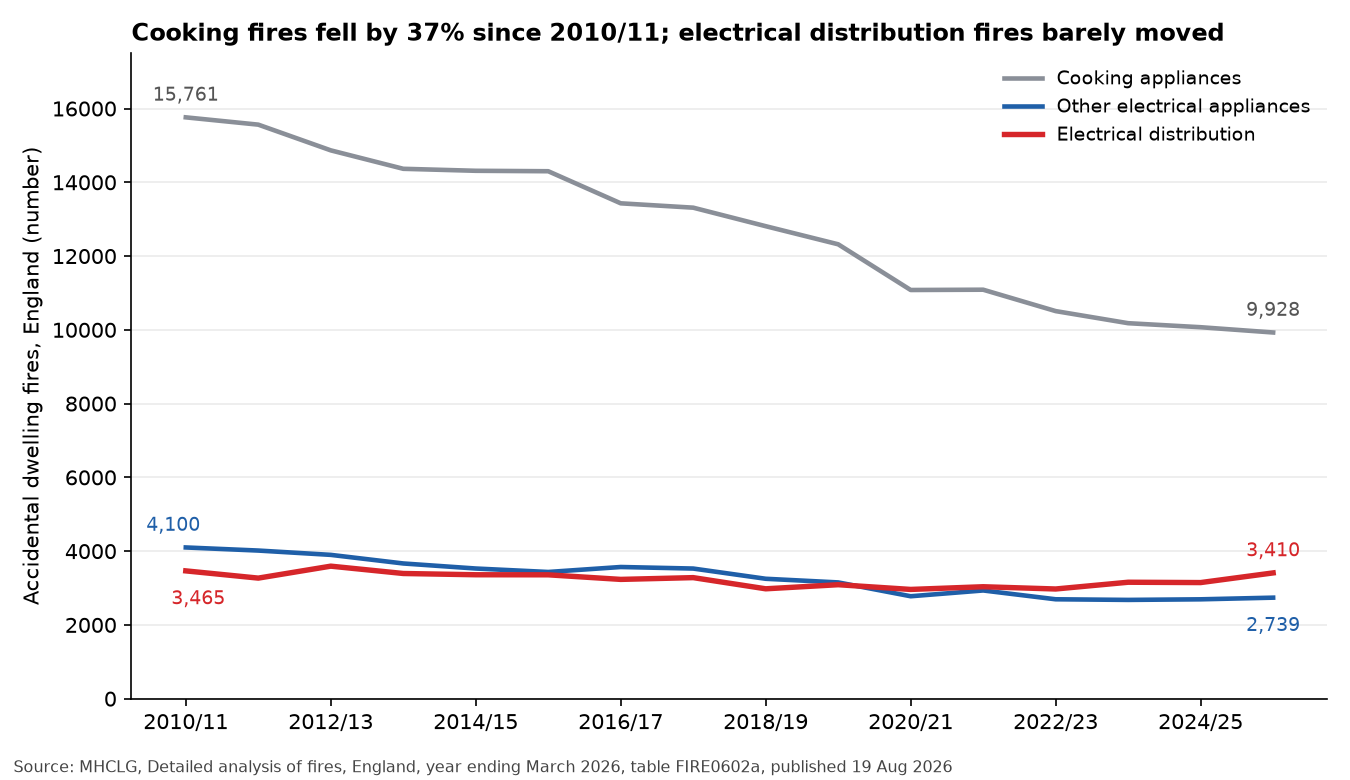
Figure 1: Fires with an electrical source of ignition have fallen far less than cooking fires since 2010/11. Source: MHCLG, Detailed analysis of fires, England, year ending March 2026 (table FIRE0602a), Mar 2026. Chart drawn from the source’s data, captured 12 Nov 2026.
What share of accidental house fires start with electricity?
In 2025/26 the two electrical source-of-ignition categories in MHCLG’s table account for about a quarter of accidental dwelling fires in England.
- Electrical distribution started 3,410 and other electrical appliances 2,739 of the 23,795 accidental dwelling fires in England in 2025/26, together 6,149 or 25.8%, our calculation (MHCLG, Aug 2026).
- Since 2010/11 electrical distribution fires have moved from 3,465 to 3,410 and other electrical appliance fires from 4,100 to 2,739, while cooking appliance fires fell 37% (MHCLG, Aug 2026).
Which appliances start the fires?
Fires started by washing machines and tumble dryers each run to several hundred a year in England.
- In 2025/26 tumble dryers were the source of ignition in 579 accidental dwelling fires and washing machines in 409, our calculation (MHCLG, Jul 2026).
- Battery chargers started 142 accidental dwelling fires in England in 2025/26, in a category that does not separate phone, tool or e-bike chargers, our calculation (MHCLG, Jul 2026).
- Electrical Safety First counted 1,140 accidental electrical fires involving tumble dryers, washing machines, fridge freezers, dishwashers and washer dryers in England in 2023/24, about three a day, its analysis of Home Office fire data (Electrical Safety First, Feb 2025).
How many people are hurt or killed?
Electrical sources cause one in five injuries in accidental house fires. Deaths swing too much from year to year to read as a trend.
- Electrical distribution and other electrical appliances accounted for 937 of the 4,314 non-fatal casualties in accidental dwelling fires in England in 2025/26, or 21.7%, our calculation (MHCLG, Aug 2026).
- Electrical distribution caused 3 and other electrical appliances 13 of the 161 deaths in accidental dwelling fires in 2025/26, against 13 and 16 of 178 the year before (MHCLG, Aug 2026).
How does Leeds and West Yorkshire compare?
West Yorkshire sits slightly above the England share for fires started by wiring, cabling and plugs. No source splits electrical fires by Leeds alone.
- West Yorkshire Fire and Rescue Service attended 940 accidental dwelling fires in 2025/26, and 107 (11.4%) started in wiring, cabling or plugs, against 10.5% in England, our calculation (MHCLG, Jul 2026).
- The service’s own performance report counts 969 accidental dwelling fires in 2024/25, against 935 in MHCLG’s incident data for the same year (our calculation from the dataset above); the report does not explain the gap (West Yorkshire Fire and Rescue Service, Aug 2025).
- Accidental dwelling fires in the Leeds district rose 13% in 2024/25 on the previous year and Wakefield rose 16%, while Bradford, Calderdale and Kirklees fell (West Yorkshire Fire and Rescue Service, Aug 2025).
Do smoke alarms go off in house fires?
Most homes have an alarm, but not every fire meets one that works. These figures cover all dwelling fires, not only electrical ones.
- In 2024/25, 93.3% of English households said they had a working smoke alarm, a self-report that is not verified (MHCLG, Aug 2026).
- In 2025/26 no smoke alarm was present in 23% (6,026) of dwelling fires in England, and an alarm was present but failed to operate in 19% (MHCLG, Aug 2026).
How many people are hurt by electricity and unsafe electrical products?
Electric shock kills far fewer people than fire does, but it still puts people in hospital every week, and the risk is shifting from fixed wiring to the products people buy and charge. Unsafe goods bought online and lithium-ion batteries now account for much of the newer harm.
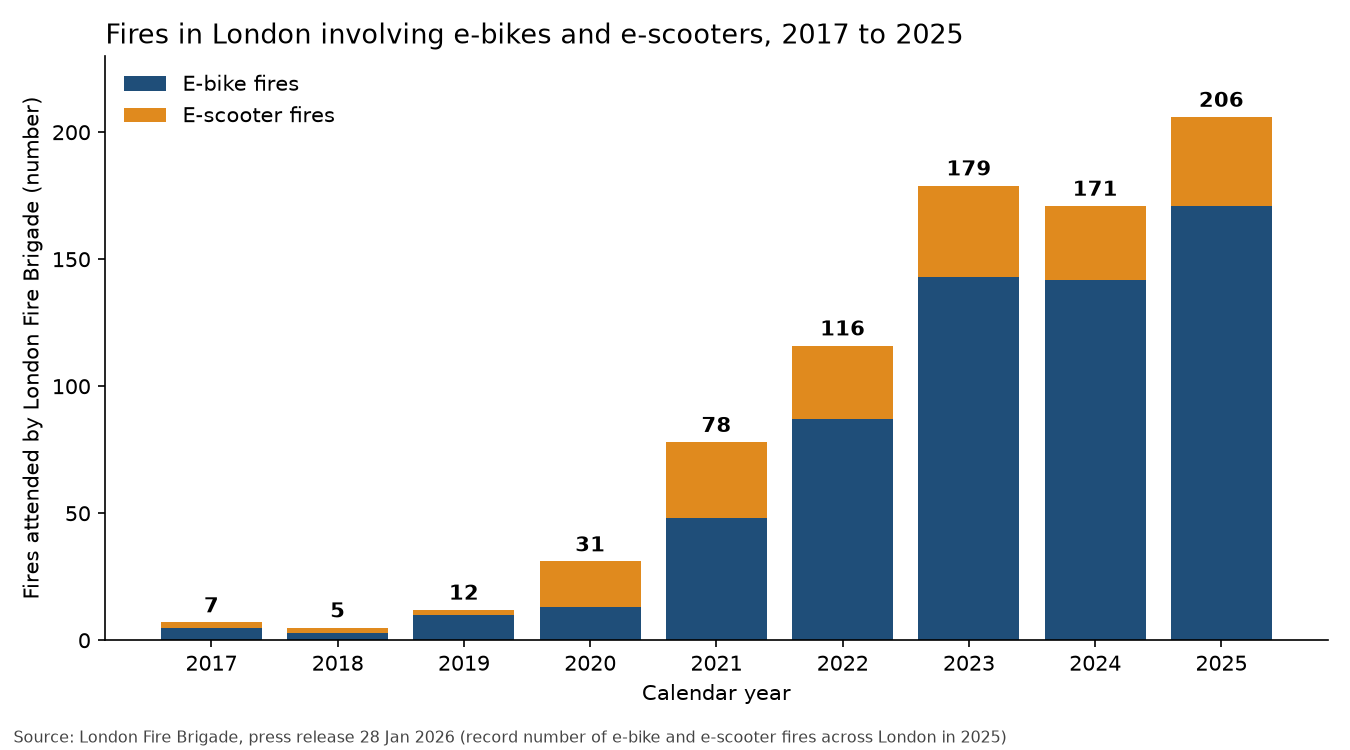
Figure 2: E-bike and e-scooter fires attended by London Fire Brigade each calendar year, 2017 to 2025. The count has risen from single figures to over 200 a year, and no national total exists. Source: London Fire Brigade, Record number of e-bike and e-scooter fires across London in 2025, Dec 2025. Chart drawn from the source’s data, captured 12 Nov 2026.
How many people die or go to hospital after an electric shock?
No single body counts every case, so workers, all deaths and hospital admissions come from three separate sources. ONS publishes no current table for these causes of death: the latest it has released covers 2013 to 2020.
- Five workers (employees and self-employed) died in Great Britain in 2025/26 after contact with electricity or electrical discharge, a provisional figure (HSE, Jul 2026).
- Contact with electricity killed 29 of the 651 workers who died from accidents in Great Britain over the five years 2021/22 to 2025/26, or 4.5% (our calculation from the same HSE table) (HSE, Jul 2026).
- Deaths in England and Wales with an underlying cause coded W85 to W87 (exposure to electric current) totalled 131 across 2013 to 2020 (our calculation from ONS’s three year-by-year tables) (ONS, Dec 2021).
- Annual deaths under those three codes ranged from 13 to 23 between 2013 and 2020, and stood at 14 in 2020, the last year ONS published (our calculation from the same ONS tables) (ONS, Dec 2021).
- English NHS hospitals recorded 418 finished admission episodes in 2025/26 with an external cause of exposure to electric current (W85 to W87), summing the three code rows (our calculation) (NHS, Sep 2026).
- Of 425 finished consultant episodes under those codes in 2025/26, 41 were for patients aged 14 or under (our calculation from the NHS age columns) (NHS, Sep 2026).
How many unsafe electrical products are reported or found?
Regulator reports and charity testing agree that electrical goods are among the most frequently reported unsafe products, and online marketplaces are where many are bought. Regulator counts are notifications, not a measure of how many unsafe products exist.
- Electrical appliances and equipment made up 545 (16%) of the 3,368 products notified on the UK Product Safety Database between 1 April 2025 and 31 March 2026, the third most notified category (OPSS, Aug 2026).
- Electric shock was the harm in 226 notifications (16% of those with a harm type) on the same database in 2025/26, behind fire at 424 (OPSS, Aug 2026).
- Electrical Safety First and Talan assessed about 24,000 product listings on major UK online marketplaces and judged 5.42% likely non-compliant with UK safety standards, a minimum estimate from listing data, not lab tests (Electrical Safety First, Apr 2026).
- Within that sample, 37.1% of travel adaptor listings were judged likely non-compliant, the highest of the product types assessed (Electrical Safety First, Apr 2026).
- All 116 counterfeit and lookalike Apple chargers that Electrical Safety First bought and tested at an independent laboratory failed the safety tests on internal electronics or plug pins (Electrical Safety First, Nov 2024).
- Of 26 outdoor electrical products bought from third-party sellers on online marketplaces and tested over a year, 96% posed a risk of electric shock (Electrical Safety First, Aug 2024).
How many fires do e-bike and e-scooter batteries cause?
Fires from e-bike and e-scooter batteries have grown sharply in London since 2019, and fire services report them voluntarily, so no national total exists.
- Fire and rescue services notified OPSS of 267 fires involving e-bikes or e-scooters in 2025, a floor rather than a national count because reporting is voluntary (OPSS, Sep 2026).
- Batteries or generators were recorded as the source of ignition in 88% of those 267 fires (OPSS, Sep 2026).
- London Fire Brigade attended 206 e-bike and e-scooter fires in 2025, of which 171 involved e-bikes (London Fire Brigade, Jan 2026).
- The 2025 London total compares with 31 in 2020, a rise of 6.6 times (our calculation from the Brigade’s table) (London Fire Brigade, Jan 2026).
- Five people have died in London e-bike and e-scooter fires since 2023, and none of the five owned the e-bike involved (London Fire Brigade, Jan 2026).
- West Yorkshire Fire and Rescue Service said in November 2025 that lithium-ion battery fires in West Yorkshire had risen 93% since 2022 (West Yorkshire Fire and Rescue Service, Nov 2025).
How old and how safe is the wiring in UK homes?
Rented homes in England are the oldest in the housing stock, and in Leeds they are in worse condition than the national average. Landlords have had to test the wiring since 2020, and the same duty now covers social housing.
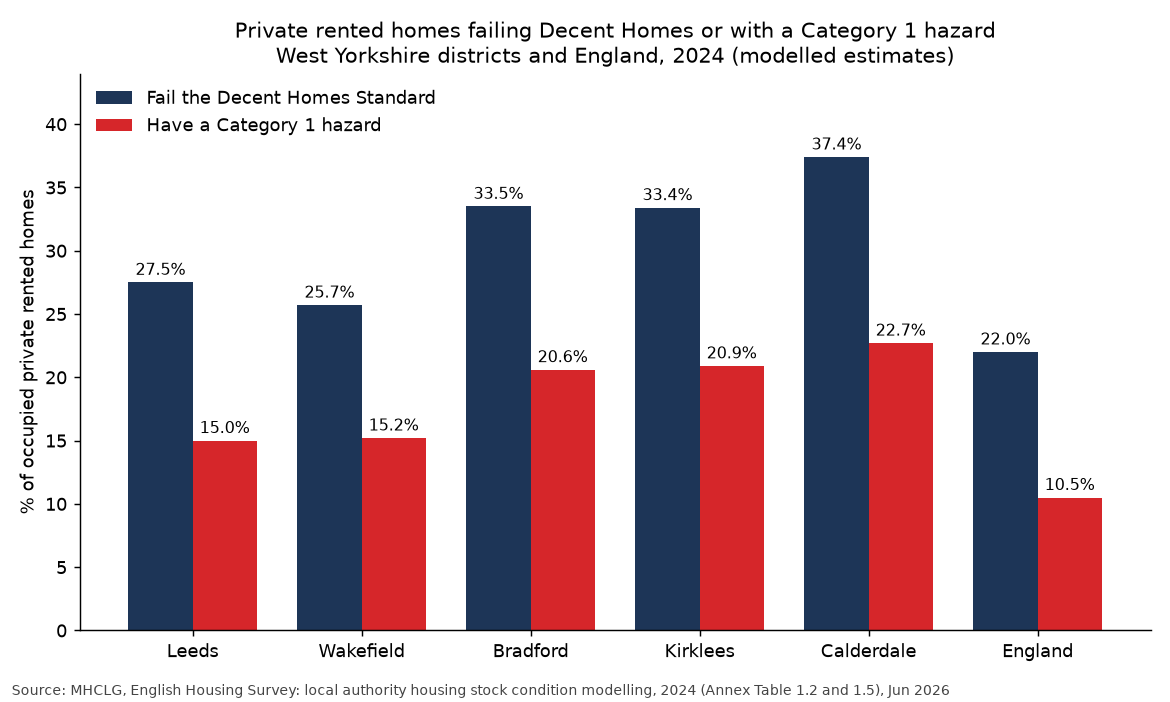
Figure 3: Share of occupied private rented homes failing the Decent Homes Standard or carrying a Category 1 hazard, West Yorkshire districts and England, 2024. Leeds sits above England on both measures and below its neighbours Bradford, Kirklees and Calderdale. Source: MHCLG, English Housing Survey: local authority housing stock condition modelling, 2024, 2024 data. Chart drawn from the source’s data, captured 12 Nov 2026.
How big is private renting and how old are the homes?
Private rented dwellings are older than any other tenure, and Leeds has a bigger rented sector than England as a whole. The figures measure dwellings built, not the age of the wiring inside them.
- The proportion of private rented dwellings in England built before 1919 was 32%, against 20% of owner occupied and 6% of social rented dwellings in 2024 (MHCLG, Dec 2025).
- In the 2021 Census, 74,402 households in Leeds rented privately (68,197 from a private landlord or letting agency and 6,205 other private rented), 21.8% of 341,466 households (our calculation from the Census 2021 tenure table) (ONS, Jan 2023).
- In the same Census, 4,794,889 of 23,436,085 households in England rented privately, 20.5% (our calculation from the Census 2021 tenure table) (ONS, Jan 2023).
- In Yorkshire and the Humber, 452,557 of 2,330,658 households rented privately, 19.4% (our calculation from the Census 2021 tenure table) (ONS, Jan 2023).
How many homes have the modern electrical safety features?
Most homes have all five features the English Housing Survey checks, and social rented homes lead. Yorkshire and the Humber falls below the England level.
- 71.8% of dwellings in England had all five electrical safety features in 2024: all PVC wiring, modern earthing, a modern consumer unit, miniature circuit breakers and an RCD. The base includes homes where a feature could not be determined, so this is a slight underestimate (MHCLG, Jul 2026).
- By tenure, 73.0% of private rented, 80.4% of social rented and 69.3% of owner occupied dwellings had all five features in 2024 (MHCLG, Jul 2026).
- In Yorkshire and the Humber, 69.3% of dwellings had all five features in 2024, below the England figure (MHCLG, Jul 2026).
How many rented homes in Leeds fail the Decent Homes Standard?
A Category 1 hazard is the most serious grade under the Housing Health and Safety Rating System and an automatic failure. These measures cover all hazards, not wiring alone.
- 15%, or 4.0 million dwellings, in England failed the Decent Homes Standard in 2024 (MHCLG, Jan 2026).
- In Leeds, an estimated 27.5% of occupied private rented homes (26,237) were non-decent in 2024, against 22.0% in England. These are modelled local estimates, labelled official statistics in development (MHCLG, Jun 2026).
- In Leeds, an estimated 15.0% of occupied private rented homes (14,329) had a Category 1 hazard in 2024, against 10.5% in England (MHCLG, Jun 2026).
What do the electrical safety rules require of landlords?
The Electrical Safety Standards in the Private Rented Sector (England) Regulations 2020 set a maximum gap between inspections, and a 2025 amendment extended them to social landlords.
- Landlords must have the electrical installation inspected and tested by a qualified person at least every 5 years (MHCLG, Nov 2025).
- Councils can impose a financial penalty of up to £40,000 for breaches of the regulations, for offences committed from 1 May 2026 (MHCLG, Nov 2025).
- Social landlords with tenancies granted before 1 December 2025 had to complete the first inspection and test before 1 November 2026 (MHCLG, Nov 2025).
- In Leeds, 69,742 households rented from a council or housing association in 2021, 20.4% of households (our calculation from the Census 2021 tenure table), the tenure the 2025 extension brings in (ONS, Jan 2023).
- Electrical Safety First used freedom of information requests to count 6,863 electrical faults recorded across 98 English local authorities in the first year of the private rented checks, from June 2020. This is the charity’s analysis of council data, and the page is read from an archived copy (Electrical Safety First, Jun 2022).
How many electric car chargers are there, at home and in public?
Public charging is growing quickly, but Leeds still sits below the UK average for chargers per head. Home charging depends on having somewhere to park off the road, and many households do not.
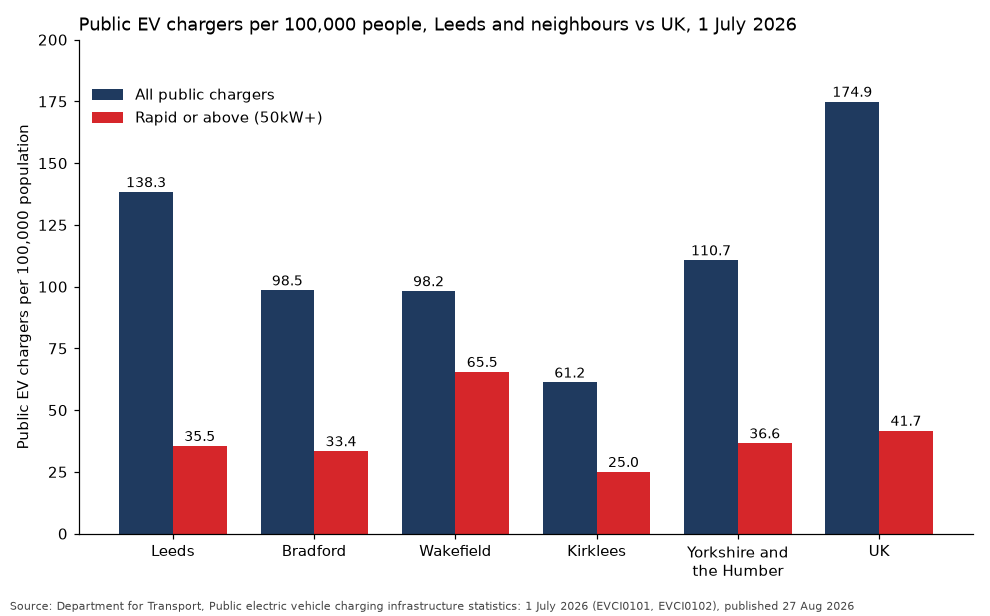
Figure 4: Public EV chargers per 100,000 population, all chargers and rapid or above (50kW+), 1 July 2026. Leeds has more chargers per head than Bradford or Wakefield but fewer rapid chargers per head than Wakefield. Source: Department for Transport, Public electric vehicle charging infrastructure statistics: 1 July 2026, Jul 2026. Chart drawn from the source’s data, captured 12 Nov 2026.
How many public chargers are there, and how does Leeds compare?
From 1 January 2026 the Department for Transport counts public chargers rather than charging devices, so earlier device totals are not comparable. The latest release combines the August quarterly tables with a November monthly update.
- The UK had 126,140 public electric vehicle chargers on 1 November 2026 (Department for Transport, Nov 2026).
- Leeds had 1,169 public chargers on 1 July 2026, or 138.3 per 100,000 people, against 174.9 per 100,000 across the UK (Department for Transport, Aug 2026).
- Leeds had 300 chargers rated 50kW or above on 1 July 2026, or 35.5 per 100,000 people, while Wakefield had 241, or 65.5 per 100,000 (Department for Transport, Aug 2026).
- Yorkshire and the Humber had 115.2 public chargers per 100,000 people on 1 November 2026, against 182.1 for the UK (Department for Transport, Nov 2026).
- There was one public charger for every 17 battery electric vehicles in the UK on 1 April 2026 (Department for Transport, Aug 2026).
How many households can charge at home?
Home chargers that people pay for themselves are not recorded, so the best national measure is the English Housing Survey, plus the grant schemes.
- 26.2% of households in England had no designated parking provision in the 2024 to 2025 survey (MHCLG, Jul 2026).
- 8.3% of households in England had a charge point available to them, whether exclusive, communal or within 100 metres, in the 2024 to 2025 survey (MHCLG, Jul 2026).
- Home charging grant schemes have funded 412,682 installations in the UK since 2013, of which 10,833 were in the 12 months to 1 July 2026 (Department for Transport, Aug 2026).
- Leeds had 286 sockets installed under the chargepoint grant for renters and flat owners, the most of any West Yorkshire authority, out of 26,504 across the UK to 1 July 2026 (Department for Transport, Aug 2026).
- Charge points sold in Great Britain for home or workplace use must have smart functionality under rules in force from 30 June 2022 (OPSS, Apr 2024).
How many electric cars are on the road?
Licensed zero emission cars are battery electric plus a small number of hydrogen cars. Plug-in hybrids are counted separately.
- There were 2,017,000 licensed zero emission cars in the UK at the end of June 2026, up 34.0% on a year earlier (Department for Transport, Sep 2026).
- Battery electric cars took 26.6% of new car registrations in the UK in the first ten months of 2026 (SMMT, Nov 2026).
- Battery electric cars took 32.0% of UK new car registrations in October 2026 alone, SMMT’s highest monthly share of the year (SMMT, Nov 2026).
How many public chargers will the UK need?
Government estimates of need are minimums and carry wide ranges. The Climate Change Committee counts charging devices, the older measure, so its total sits below the chargers count above.
- The Department for Transport estimated that at least 300,000 public chargepoints would be needed across the UK by 2030 (National Audit Office, Dec 2024).
- Around 44% of all public chargepoints in the UK were in London and the South East when the National Audit Office reported in 2024 (National Audit Office, Dec 2024).
- Public charging devices in the UK rose 19% in 2025, from 74,000 to 88,000 (Climate Change Committee, Jun 2026).
How fast are UK homes going electric?
Rooftop solar and smart meters are already mainstream, while heat pumps are growing from a small base and slipped back in 2026. Official forecasts put electric heat at the centre of the next rise in demand on home electrics.
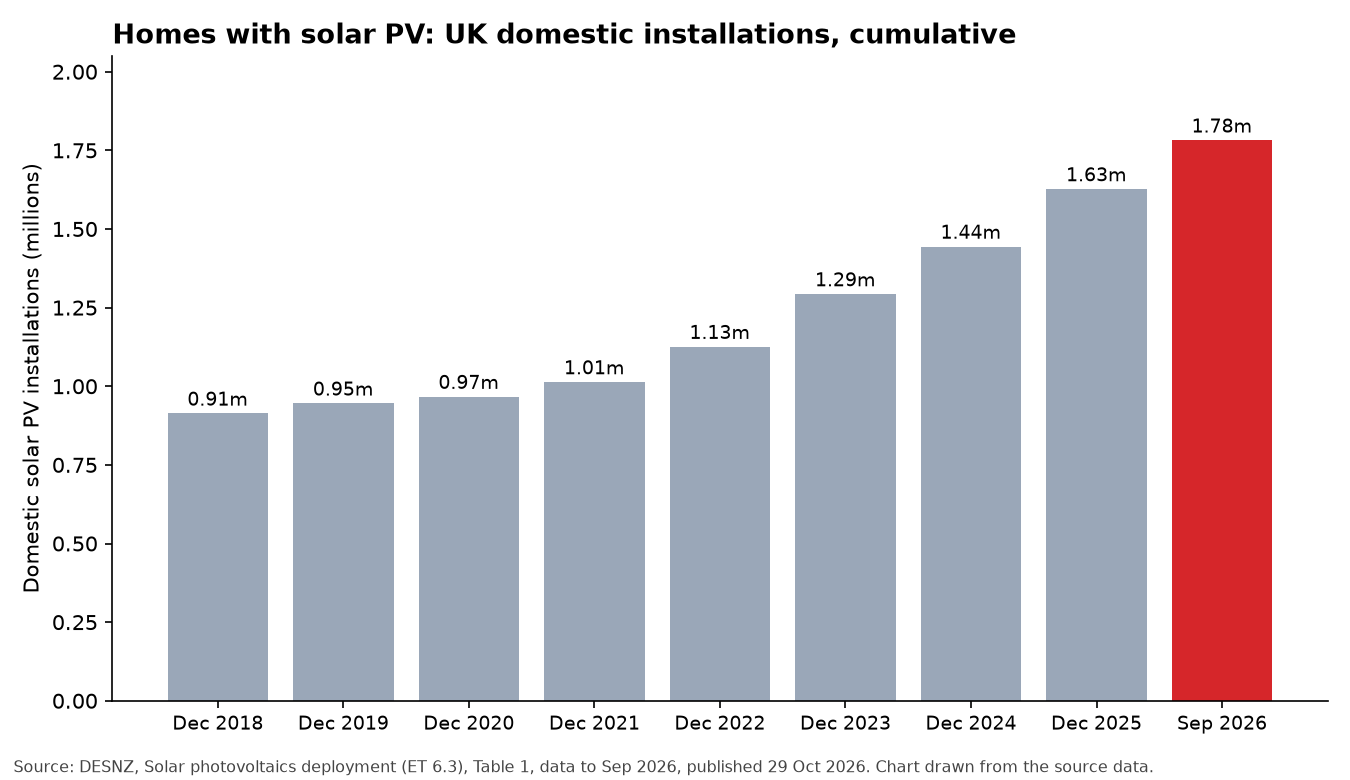
Figure 5: Cumulative domestic solar PV installations in the UK, which has risen every year since 2018 and fastest since 2022. Source: DESNZ, Solar photovoltaics deployment (ET 6.3), September 2026. Chart drawn from the source’s data, captured 12 Nov 2026.
How many UK homes already generate their own electricity?
Around 1.8 million homes have solar PV, and the pace of new installations is at a record.
- There were 1,781,735 domestic solar PV installations in the UK at the end of September 2026 (DESNZ, Oct 2026).
- Almost 200,000 homes had solar installed in the 12 months to September 2026, adding more than 1 GW of domestic capacity (DESNZ, Oct 2026).
- The seven Leeds constituencies had 11,376 domestic solar installations at the end of September 2026, our calculation from DESNZ Table 3 (Yorkshire and The Humber as a whole: 142,247) (DESNZ, Oct 2026).
- MCS certified 210,000 small-scale renewable installations (solar, batteries, heat pumps and others) across the UK in January to June 2026, a record start to a year (MCS, Aug 2026).
- MCS certified 148,531 rooftop solar installations in the UK in January to June 2026 (MCS, Aug 2026).
- MCS certified 36,000 battery storage installations in the first half of 2026, almost matching the 40,000 for the whole of 2025 (MCS, Aug 2026).
Are heat pumps taking off?
Not yet in existing homes: installations rose to 2025 and then fell in 2026. The two main counts differ because DESNZ includes retrofit installations only and leaves out new builds.
- The UK had 20,895 retrofit heat pump installations in January to June 2026, 22% fewer than the 26,768 in the same months of 2025 (DESNZ, Sep 2026).
- MCS counted just over 25,000 certified heat pump installations in January to June 2026, 17% fewer than a year earlier (MCS, Aug 2026).
- Leeds had 268 Boiler Upgrade Scheme heat pump installations paid for in 2025/26, out of 30,910 across England and Wales (DESNZ, Oct 2026).
- The Climate Change Committee’s Balanced Pathway has 52% of existing UK homes heated by a heat pump by 2040, against around 1% in 2023 (Climate Change Committee, Feb 2025).
How many meters are smart?
Most of Great Britain’s meters are now smart or advanced, and most smart meters send readings to the supplier automatically.
- Smart and advanced meters made up 72% of all meters in Great Britain at the end of June 2026, 42 million in homes and small businesses (DESNZ, Aug 2026).
- Of the 40 million smart meters in Great Britain, 92% were operating in smart mode at the end of June 2026 (DESNZ, Aug 2026).
How much more electricity will homes and networks carry?
Forecasts, not measurements, but both national bodies expect demand to more than double by 2050. NESO covers Great Britain and the Climate Change Committee covers the UK, so the figures differ.
- NESO’s net zero pathways raise Great Britain’s annual electricity demand from 290 TWh in 2024 to between 705 and 797 TWh in 2050 (NESO, Jul 2025).
- NESO’s pathways assume heat pump installation rates rise by an average of 31% a year until new gas boilers are phased out in 2035 (NESO, Jul 2025).
- The Climate Change Committee’s Balanced Pathway raises UK gross annual electricity demand from 274 TWh in 2023 to 692 TWh in 2050 (Climate Change Committee, Feb 2025).
- An estimated 3.9 million household electricity connections in Great Britain are looped, meaning shared with neighbouring homes, which is 14% of 28.5 million connections (DESNZ, Dec 2025).
How much electricity does a home use, and what does it cost?
A Leeds home uses slightly less electricity than the British average, and most of it goes on plugged-in appliances rather than lighting or cooking. Price is the part that moves, and the October 2026 cap comes with a tax change that makes quarter-on-quarter comparisons misleading.
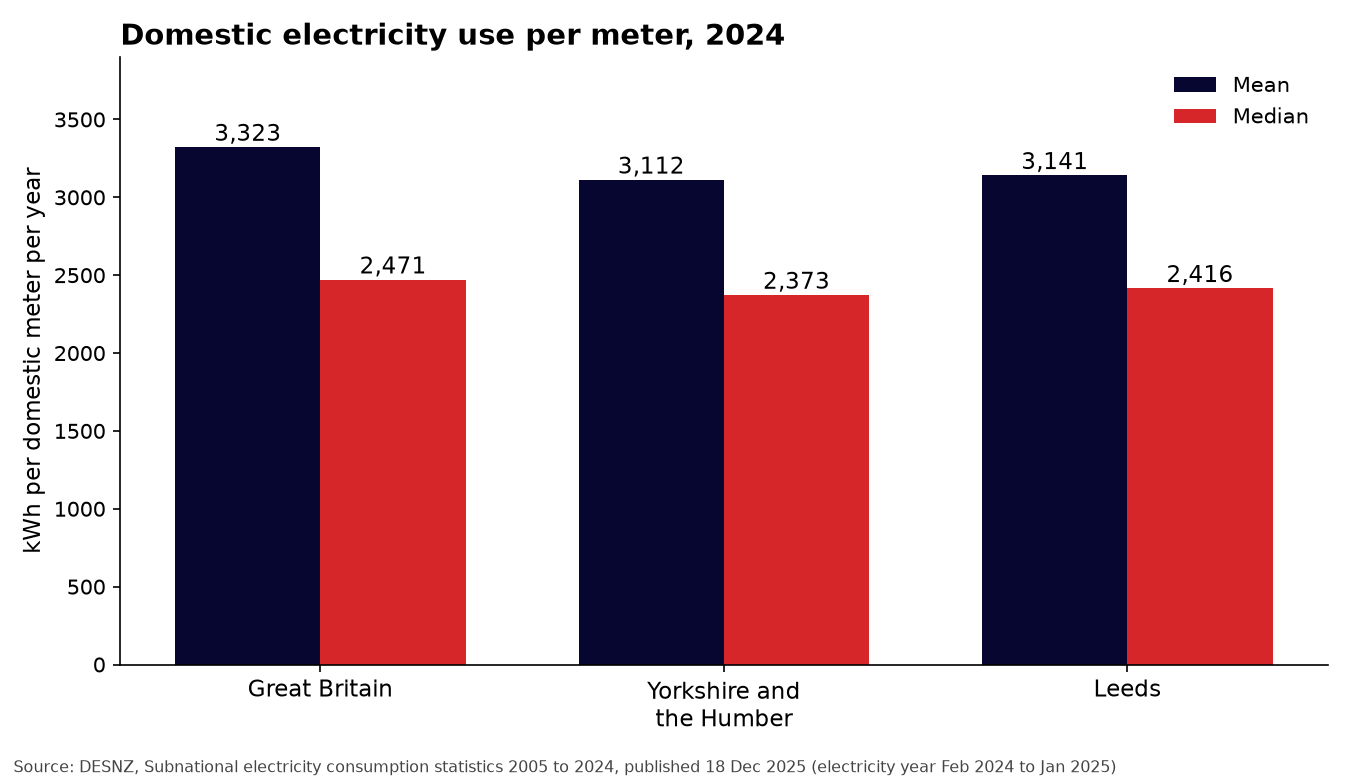
Figure 6: Mean and median domestic electricity use per meter, 2024, showing Leeds just below the British mean and median. Source: DESNZ, Subnational electricity consumption statistics 2005 to 2024, electricity year February 2024 to January 2025. Chart drawn from the source’s data, captured 12 Nov 2026.
How much electricity does a Leeds home use?
The average meter in Leeds draws a little under the Great Britain figure, and the typical meter sits well below the mean because a minority of homes use far more.
- The mean domestic meter in Great Britain used 3,323 kWh in 2024 and the median meter used 2,471 kWh (DESNZ, Dec 2025).
- Leeds domestic meters averaged 3,141 kWh with a median of 2,416 kWh in 2024, against 3,112 kWh and 2,373 kWh across Yorkshire and the Humber (DESNZ, Dec 2025).
- Mean domestic use per Great Britain meter fell 15.6% between 2015 (3,938 kWh) and 2024 (3,323 kWh), our calculation from the same DESNZ workbook (DESNZ, Dec 2025).
What is electricity used for at home?
Appliances dominate, and the ratings on them change what they cost to run.
- UK domestic electricity consumption rose 2.6% to 8.3 million tonnes of oil equivalent in 2025, in what DESNZ describes as the warmest year on record (DESNZ, Sep 2026).
- Appliances took 5,586 of the 8,271 thousand tonnes of oil equivalent of UK domestic electricity in 2025, 68% by our calculation from DESNZ table U3 (DESNZ, Sep 2026).
- Energy Saving Trust puts fridges and freezers at around 13% of the average household energy bill (Energy Saving Trust, Aug 2026).
- Energy Saving Trust says switching appliances off standby saves around £45 a year in Great Britain (Energy Saving Trust, Aug 2026).
- An A-rated 12-place dishwasher costs £35 a year to run in Great Britain and a G-rated equivalent £70, according to Energy Saving Trust’s modelling (Energy Saving Trust, Aug 2026).
What does electricity cost now?
The cap rates for October to December 2026 are a snapshot, and electricity prices now exclude VAT.
- The price cap for 1 October to 31 December 2026 is 26.32p per kWh with a 54.83p daily standing charge for electricity, against 26.11p and 57.19p in the previous quarter, Great Britain average on Direct Debit (Ofgem, Aug 2026).
- VAT on electricity is 0% from 1 October 2026 to 31 March 2027, down from 5%, so the two quarters cannot be compared like for like (Ofgem, Aug 2026).
- In the Yorkshire region, single-rate electricity on Direct Debit costs £865.16 a year at 2,500 kWh under the October cap, against £858.20 for the Great Britain average (Ofgem, Aug 2026).
- Ofgem’s typical medium electricity use is now 2,500 kWh a year, around 7% lower than at its previous review (Ofgem, Aug 2026).
- The average UK standard electricity bill was £1,069 in 2025 at a fixed 3,400 kWh, down 1.3% on 2024 (DESNZ, Mar 2026).
How clean is the electricity?
Most generation is now low carbon, though gas still sets the price.
- Renewables supplied a record 55.8% of UK electricity generation in the second quarter of 2026 (DESNZ, Sep 2026).
- Zero-carbon sources supplied 97.7% of Great Britain’s electricity for 30 minutes on 1 April 2025, the closest the system has come to fully zero-carbon operation (NESO, Jan 2026).
- Great Britain’s electricity averaged 125 gCO2/kWh in 2024, its lowest carbon intensity year to that point (NESO, Jan 2025).
How many electricians are there, and how is the trade regulated?
The trade is smaller than it was five years ago, it is paid about the same hourly as the average UK employee, and domestic work is policed by a short list of certification schemes working to one standard. The trade bodies put the shortage down to a training pipeline that does not turn learners into electricians.
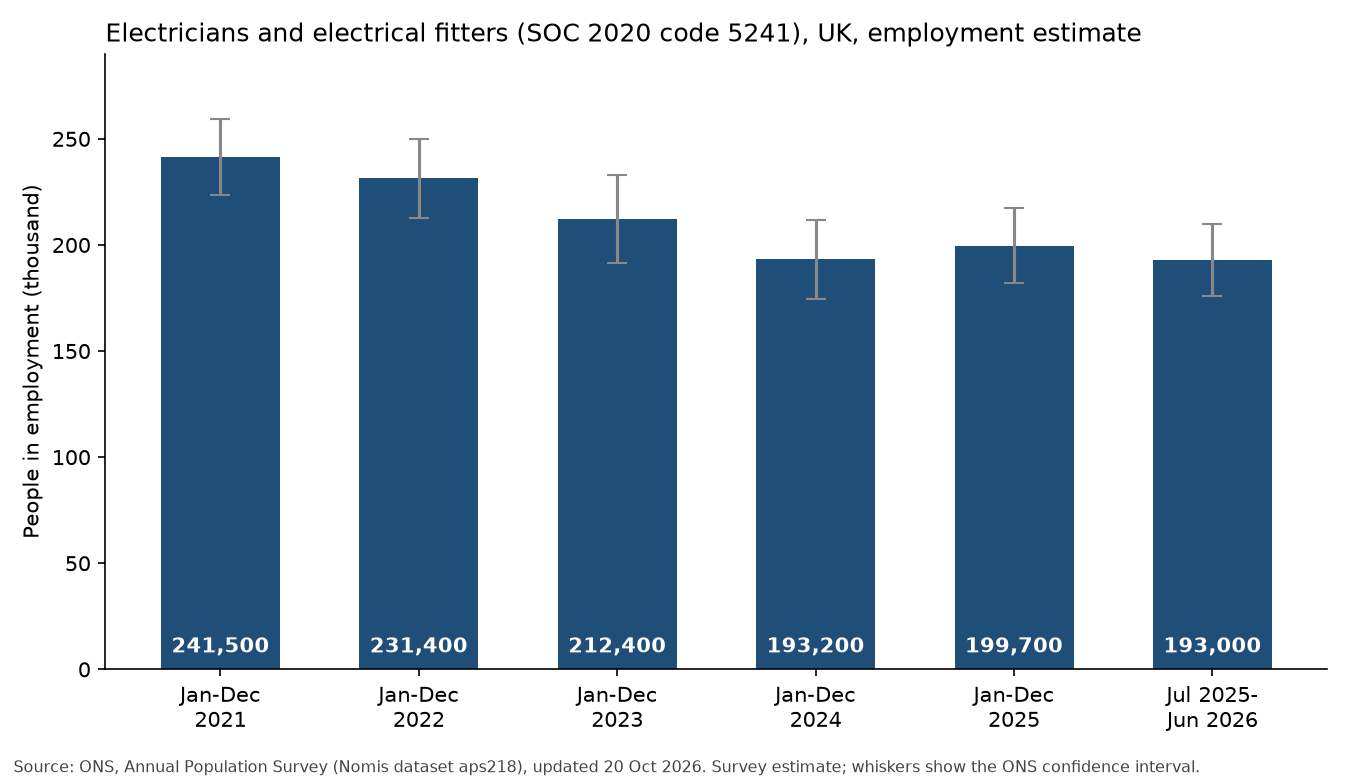
Figure 7: Survey estimates of UK employment for electricians and electrical fitters (SOC 2020 code 5241) fell between 2021 and 2024 and have been flat since, within the margin of error. Source: ONS, Annual Population Survey, Nomis dataset aps218, Jul 2025 to Jun 2026. Chart drawn from the source’s data, captured 12 Nov 2026.
How many electricians work in the UK?
ONS counts people from a household survey, so every figure below is an estimate with a margin of error. Trade bodies count in other ways and get different totals.
- An estimated 193,000 people in the UK worked as electricians and electrical fitters in the year to June 2026, with a confidence interval of plus or minus 16,900 (ONS, Oct 2026).
- The same survey put the figure at 241,500 for January to December 2021, so our calculation from the two estimates is a fall of about a fifth (ONS, Oct 2026).
- Of the 193,000, an estimated 63,200 were self-employed, with the rest employees (ONS, Oct 2026).
- An estimated 6,800 of the 193,000 were women, all of them employees (ONS, Oct 2026).
- ECA says the UK has 136,000 fully qualified electricians and a further 40,000 people working as electricians or electrical fitters without the right qualification (ECA, Nov 2026). ECA’s own claim, on an undated page.
What do electricians earn?
ONS pay figures cover employees only, so they leave out the 63,200 self-employed.
- Median gross weekly pay for electricians and electrical fitters in the UK was £780.70 in April 2026, against £673.10 for all employees (ONS, Oct 2026).
- Median hourly pay excluding overtime was £19.00, against £18.95 for all employees (ONS, Oct 2026).
Why does the trade say it is short of electricians?
- ECA says there are 24,000 current apprentices (ECA, Nov 2026).
- ECA says the trade needs 12,000 more newly qualified electricians each year (ECA, Nov 2026).
- ECA says recruitment must reach 6% of the existing workforce each year to hold numbers steady, and that the average in England is under 4% (ECA, Nov 2026).
- ECA’s analysis found electrical apprenticeship starts fell 5.5% over the past year, while apprenticeship starts overall rose 4.1% (ECA, Feb 2026).
- ECA found that fewer than 1 in 5 of the 26,000 learners on government-funded classroom electrical courses in England in 2024 to 2025 reached an apprenticeship or skilled job within 12 months (ECA, Feb 2026).
- In the Building Engineering Business Survey run by ECA with BESA, SELECT and SNIPEF, 37% of respondents named a shortage of qualified electricians as holding back growth, for the twelfth quarter running (survey sample not stated) (ECA, Mar 2025).
Who regulates domestic electrical work?
- MHCLG lists five authorised competent person schemes for installing fixed electrical wiring in dwellings: BESCA, Blue Flame Certification, Certsure (NICEIC), NAPIT and OFTEC (MHCLG, Sep 2026).
- NICEIC says more than 40,000 businesses are certified with it, across all trades it covers (NICEIC, Nov 2026). NICEIC’s own claim.
- NAPIT says it has more than 22,000 members, across all trades it covers (NAPIT, Nov 2026). NAPIT’s own claim.
- Amendment 4 to BS 7671:2018 was published on 15 April 2026, and Amendments 2 and 3 were withdrawn on 15 October 2026 (IET, Apr 2026).
- The IET gives the length of BS 7671 as 640 pages (IET, Apr 2026).
Methodology and Sources
Every statistic on this page was read on the publisher’s own page, spreadsheet or report in November 2026, and each one links to that document. We cite the body that produced the figure, not a news report about it. The month and year after each link is when the figure was published, which is often later than the period it describes, so the period is stated in the sentence.
Three rules shape what is here. Figures that measure different things are not blended: where two bodies count the same thing differently (heat pump installations, public chargers, the number of electricians) the page gives both and says why they differ. Anything we worked out ourselves from published numbers is marked as our calculation. Figures for Leeds, West Yorkshire and Yorkshire and the Humber appear only where the source publishes them at that level.
The charts are drawn from the source’s own data and each caption names the table used. Survey figures carry a margin of error, modelled local estimates are labelled as such, and several series are provisional and will be revised. Claims that scheme and trade bodies make about their own membership are identified as theirs.
Sources
- Ministry of Housing, Communities and Local Government (MHCLG): fire statistics, English Housing Survey, local stock condition modelling and the electrical safety standards guidance.
- Department for Energy Security and Net Zero (DESNZ): solar deployment, heat pump deployment, Boiler Upgrade Scheme, smart meters, subnational electricity consumption and energy consumption in the UK.
- Office for National Statistics (ONS): Census 2021, Annual Population Survey, Annual Survey of Hours and Earnings and mortality data.
- Department for Transport: electric vehicle public charging infrastructure statistics and chargepoint grant data.
- Office for Product Safety and Standards (OPSS), Health and Safety Executive (HSE) and NHS England.
- Ofgem and the National Energy System Operator (NESO).
- London Fire Brigade and West Yorkshire Fire and Rescue Service, for their own incident data.
- Electrical Safety First, ECA, IET, NICEIC, NAPIT, MCS, SMMT and Energy Saving Trust, for research and data they produced.
- Climate Change Committee and National Audit Office.
Glossary
- EICR: an Electrical Installation Condition Report, the inspection and test of the fixed wiring in a property.
- Consumer unit: the fuse box, which holds the main switch and the protective devices for each circuit.
- RCD: a residual current device, which cuts the power within a fraction of a second when current leaks to earth.
- AFDD: an arc fault detection device, which disconnects a circuit when it detects the arcing that can start a fire.
- Electric shock: the effect of current passing through the body.
- BS 7671: the IET Wiring Regulations, the UK standard for electrical installations.
- Smart charger: a home car charger that can shift charging to cheaper, quieter hours, as required of new home chargers since 2022.
- DNO notification: telling the local network operator about a new charger, heat pump or solar system.
- NICEIC and NAPIT: the two largest schemes that assess and register electricians.
- Category 1 hazard: a serious and immediate risk to health or safety under the Housing Health and Safety Rating System.
More electrical terms are explained in the Martin Day Electricians glossary.